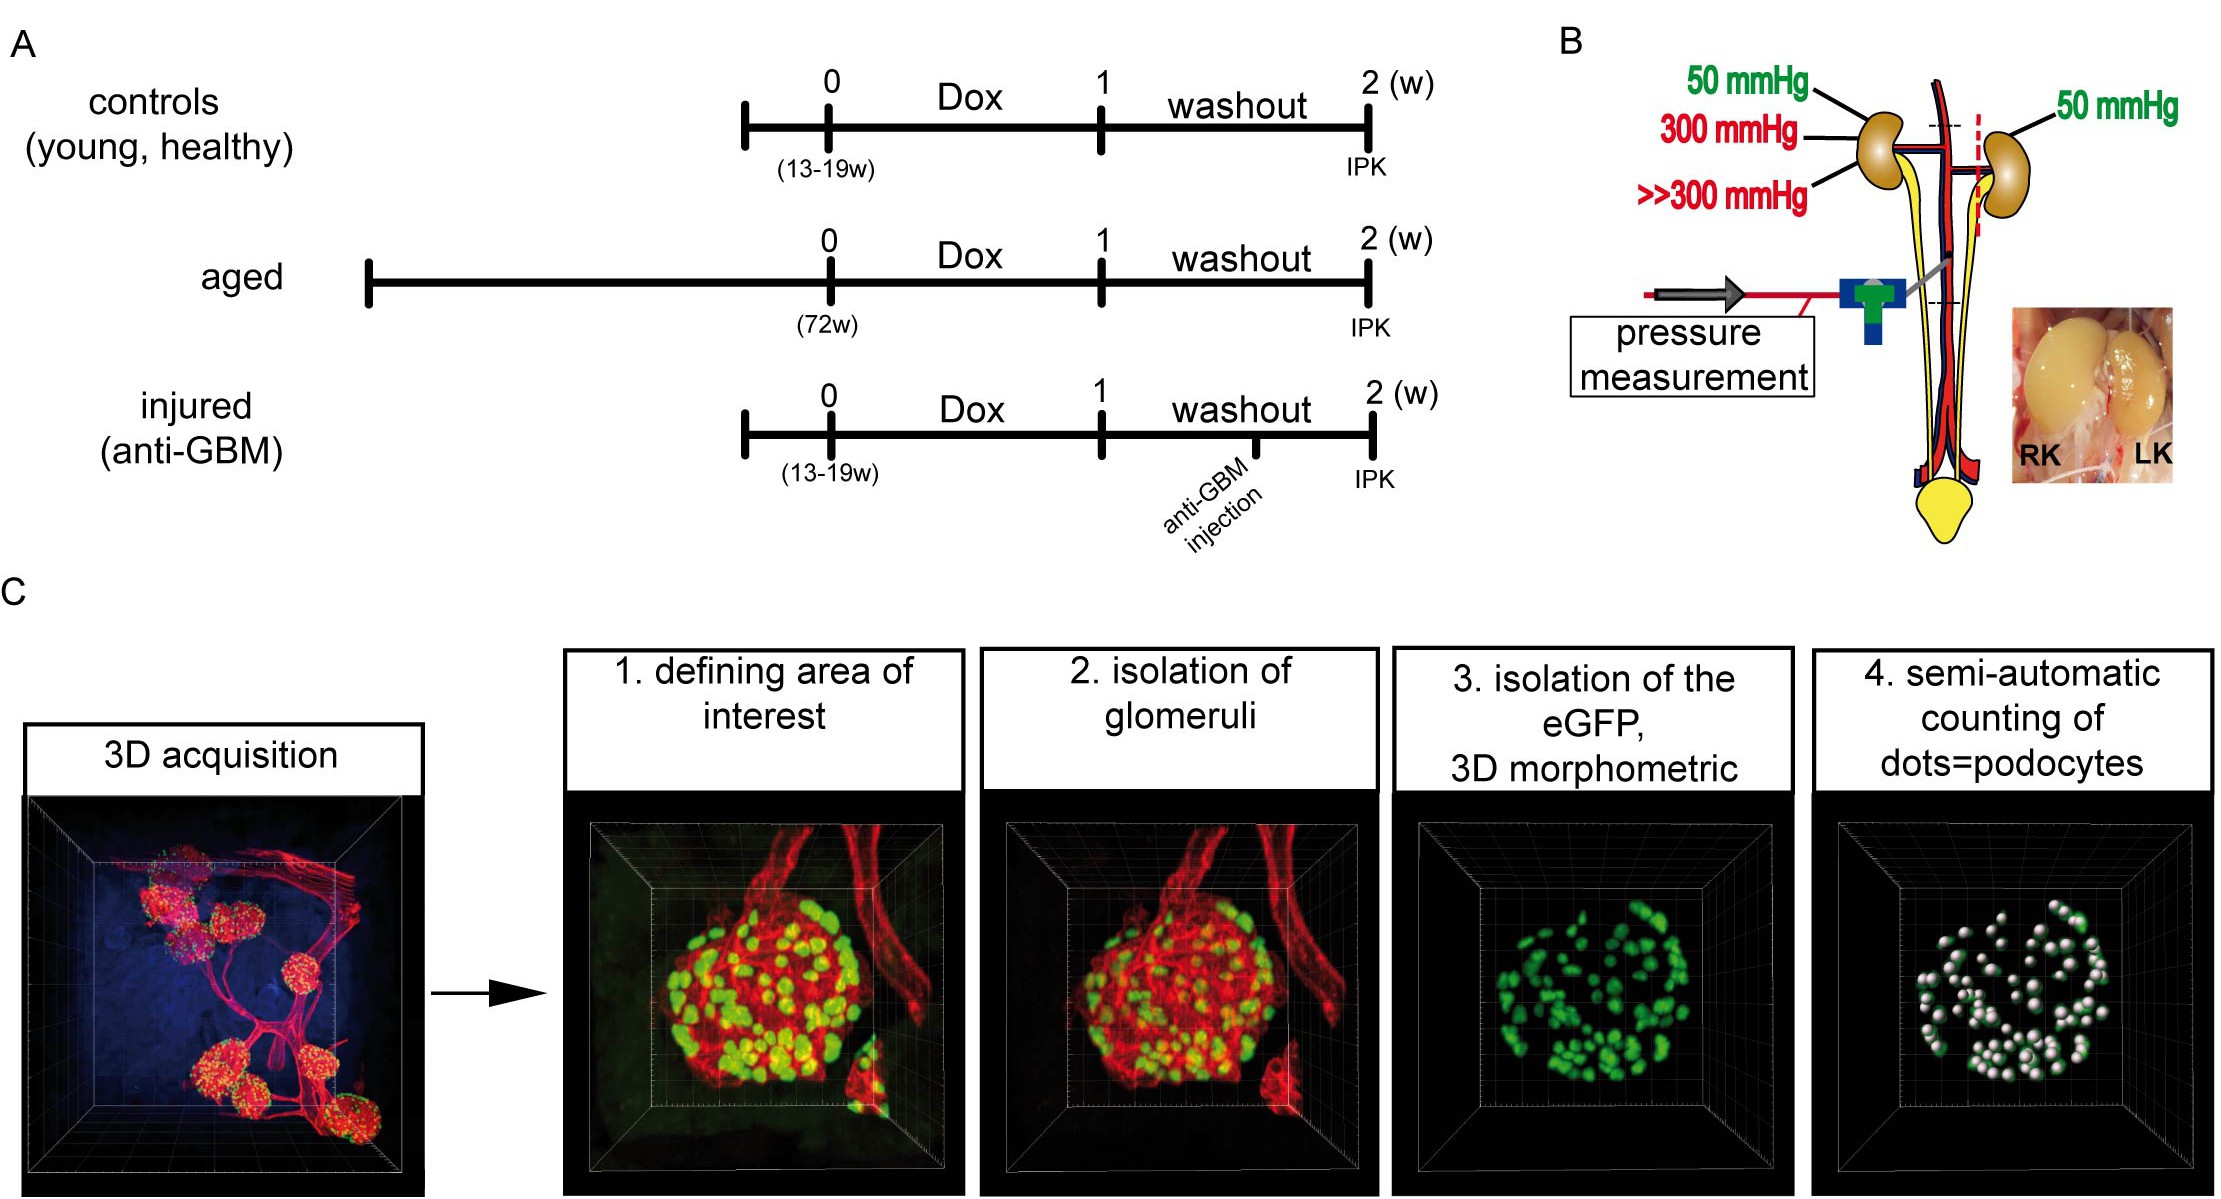
Fig. 1. Experimental setup. (A) Experimental design using the indicated mouse models. (B) Schematic of the perfusion circuit and the ligatures placed during surgery. Perfusion buffer was pumped at controlled perfusion pressures, as verified by a pressure transducer. Both kidneys were perfused for 5 minutes at 50 mmHg. Next, the left kidney was removed and the right kidney was perfused either for additional 5 minutes at 300 mmHg or with supramaximal pressure (>>300 mmHg). The black lines show the area of the respective ligature. Inset: View through the microscope into the murine situs after perfusion with 50 mmHg (left kidney, LK) and >>300 mmHg pressure perfusion of the right kidney, which is enlarged due to edematous swelling. (C) Semi-automatic method to determine the number of podocytes per glomerulus involves 3D-acquisition and computational analysis; DOX: doxycycline; green valve: perfusion cannulation.